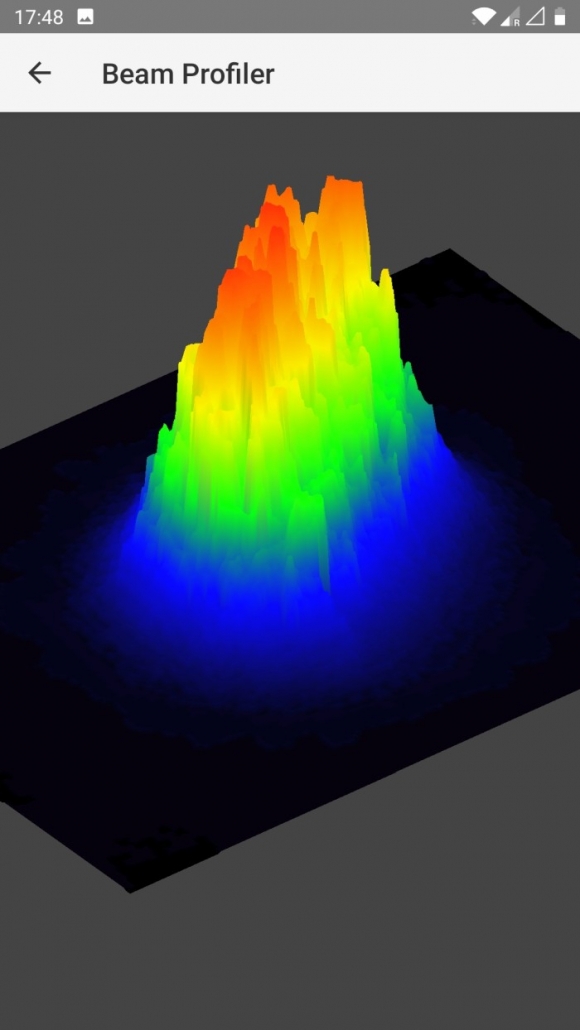
3D Visualization
We have added a feature to our beam-profiling app which allows to visualize the measured profiles in 3D.
After making a measurement, you will first see the intensity distribution of the laser beam as a 2D image, together with the results of the fitted Gaussian curves. We have added a “3D View”-button which leads to a new screen, showing a three-dimensional view of the beam profile. By swiping horizontally or vertically you can rotate the scene or change the vertical observation angle, while the usual pinch gestures are used to zoom in and out.
For more detailed analysis and fully customizable 3D views, you can always export your data to Matlab / Octave. But we hope that the new feature will be useful for quick evaluations of the measured profiles in three dimensions, directly on the smartphone.


