Export to Matlab / Octave
After recording a laser beam profile with our smartphone app, you can export the data to your computer for further analysis.
Start by using the “share” button at the top of the app screen, and select “Save to Drive”, “Gmail”, or a similar option. The beam profile is exported as an image file in PNG format, which you can download on your computer.
Open Matlab or Octave, and import the image:
A = imread("beamprofile.png");   %adjust file name and path
imshow(A);                       %display RGB image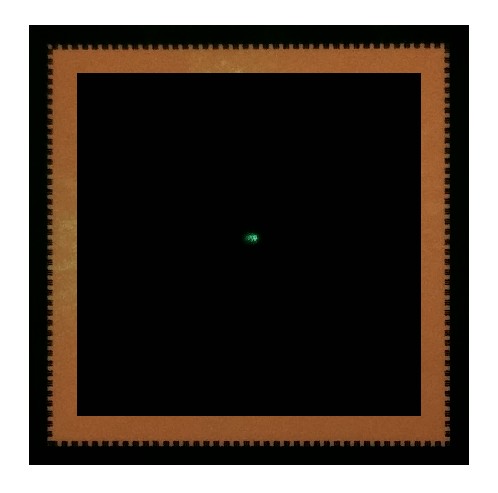
The matrix A has three channels (RGB) of 2048 x 2048 pixels each. Choose one of the channels – for example a green laser spot would show the strongest signal in the second channel:
G = A(:,:,2);   %extract the green channel
imshow(G);      %show channel as greyscale image
axis("on");     %show axis labels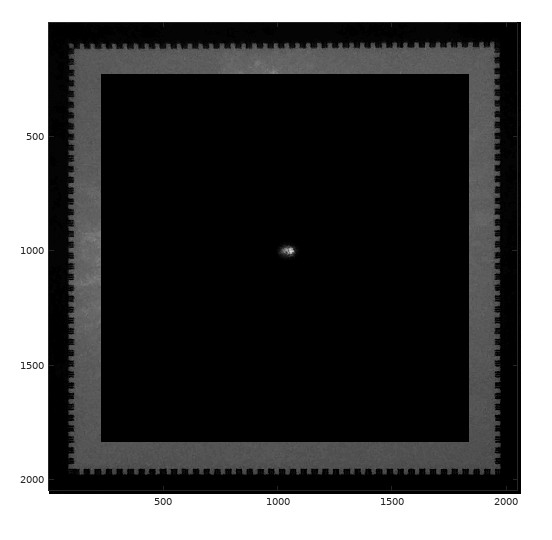
We restrict the data to a small region of interest around the laser spot:
D = G(900:1100,930:1130);   %adjust region of interest
imshow(D);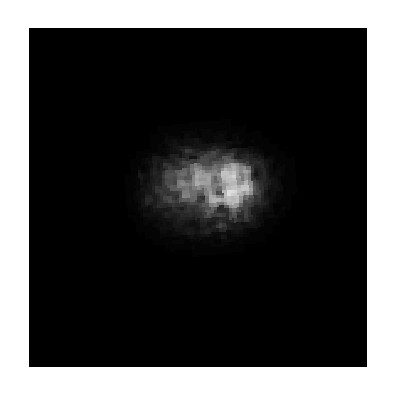
Convert the data type from uint8 to double, which is the default type in Octave and Matlab – otherwise some commands for 3D visualization may not work later on.
D = double(D); %convert to doubleAfter conversion to double type, we will need to specify the value range when displaying the image. We can apply a color map as well:
imshow(D,[0 255]);
colormap("jet");   %choose your favorite color map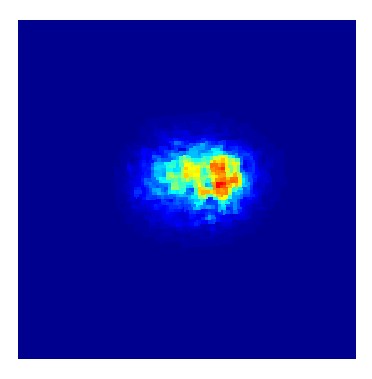
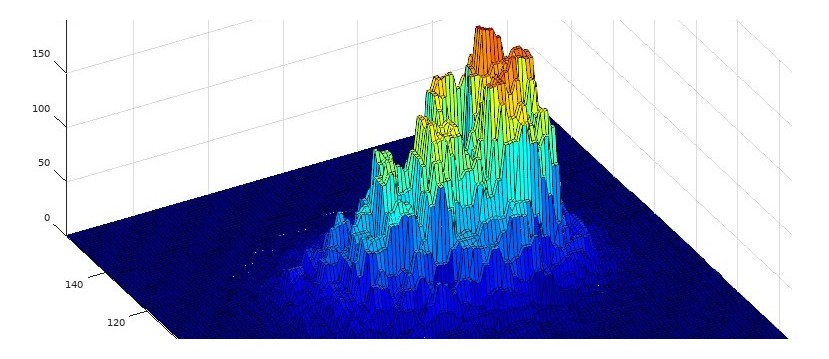
Visualize the beam profile in 3D:
surf(D);          %as an alternative try mesh(D)
caxis([0 255]);   %value range for color map
colormap("jet");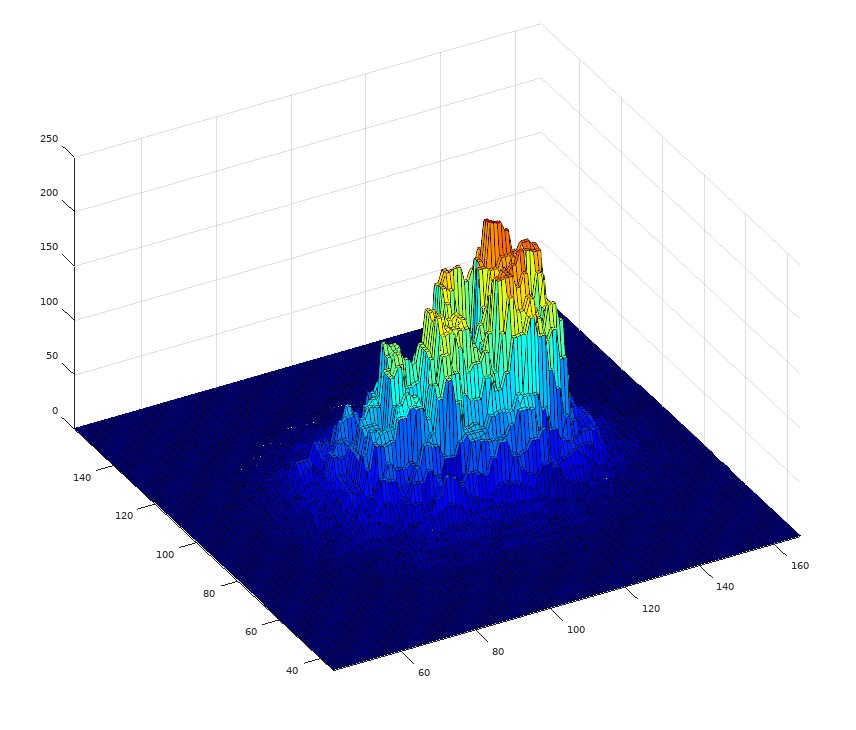
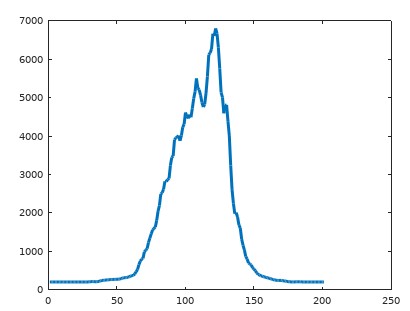
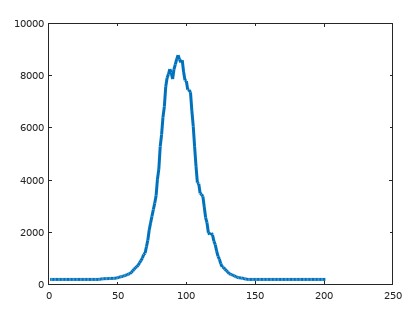
Plot signal after integration along rows and columns:
plot(sum(D));
plot(sum(transpose(D));